


datamatrix.convert
A set of functions to convert DataMatrix and column objects to and from other data structures, notable pandas.DataFrame, mne.Epochs(), and JSON strings. This module is typically imported as cnv for brevity:
from datamatrix import convert as cnv
function from_json(s)
Requires json_tricks
Creates a DataMatrix from a json string.
Arguments:
s-- A json string.- Type: str
Returns:
A DataMatrix.
- Type: DataMatrix.
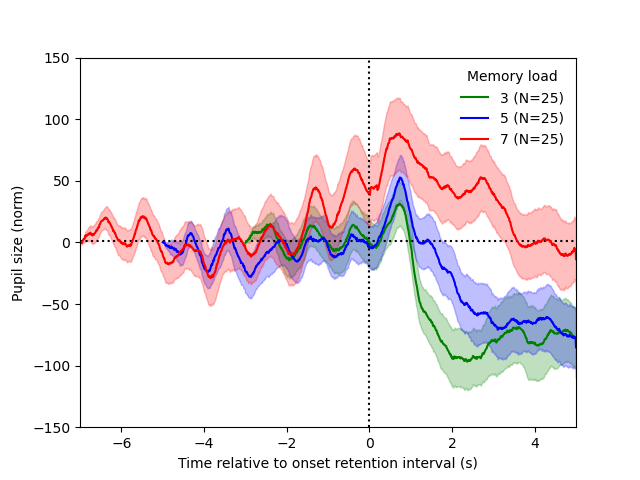
function from_mne_epochs(epochs, ch_avg=False)
Python MNE is a library for analysis of neurophysiological data.
This function converts an mne.Epochs() object to a multidimensional
column. The column's metadata is set to the epochs.info property. The
length of the datamatrix should match the length of the metadata that
was passed to mne.Epochs(). Rejected epochs result in nan values
in the corresponding rows of the column.
If channels are averaged, the shape of the resulting column is two-dimensional, where the first dimension is the number of rows and the second dimension is sample time.
If channels not are averaged, the shape of the resulting column is three-dimensional, where the first dimension is the number of rows, the second dimension is the channel (which can be referenced by name), and the third dimension is sample time.
Version note: New in 1.0.0
import numpy as np
import pickle
import mne
from matplotlib import pyplot as plt
from datamatrix import operations as ops, convert as cnv

# First read a simple dataset that contains data from three occipital EEG
# channels (O1, O2, Oz). `events` is an mne style array with event codes
# and timestamps. `dm` is a datamatrix with trial information.
with open('data/eeg-data.pkl', 'rb') as fd:
    raw, events, dm = pickle.loads(fd.read())
# Create an Epochs object and convert it to a multidimensional column (dm.erp)
epochs = mne.Epochs(raw, events, tmin=-.05, tmax=1.5,
                    metadata=cnv.to_pandas(dm))
dm.erp = cnv.from_mne_epochs(epochs)
# The last dimension corresponds to time, and the `index_names` property
# contains the timestamps in seconds.
channels = dm.erp.index_names[0]
timestamps = dm.erp.index_names[1]
# Split the data by stimulus intensity, and plot the mean signal over time
plt.title(f'channels = {channels}')
for intensity, idm in ops.split(dm.intensity):
    # Average over trials and channels, but not time
    plt.plot(timestamps, idm.erp[..., ...], label=str(intensity))
plt.legend(title='Stimulus intensity')
plt.xlabel('Time (s)')
plt.ylabel('Voltage')
plt.show()
Output:
Adding metadata with 2 columns
400 matching events found
Setting baseline interval to [-0.048, 0.0] s
Applying baseline correction (mode: mean)
0 projection items activated
Using data from preloaded Raw for 400 events and 388 original time points ...
47 bad epochs dropped
Arguments:
epochs-- No description- Type: mne.Epochs
Keywords:
ch_avg-- Determines whether the epochs should be averaged across channels or not.- Type: bool
- Default: False
Returns:
No description
- Type: MultiDimensionalColumn
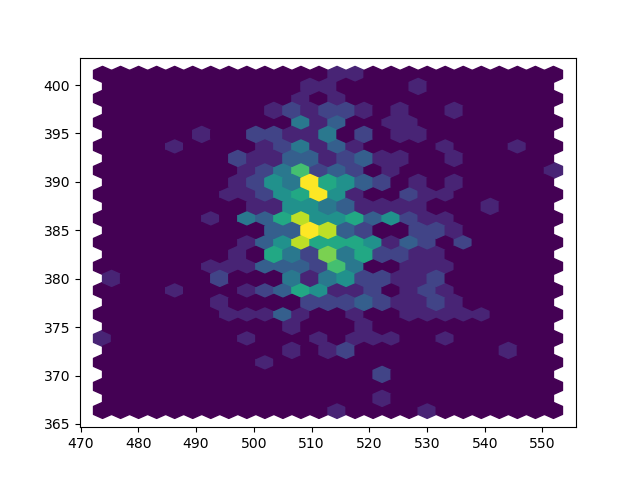
function from_mne_tfr(tfr, ch_avg=False, freq_avg=False)
Python MNE is a library for analysis of neurophysiological data.
This function converts an mne.EpochsTFR() object to a
multidimensional column. The column's metadata is set to the
tfr.info property. The length of the datamatrix should match the
length of the metadata that was passed to mne.Epochs(). Rejected
epochs result in nan values in the corresponding rows of the column.
If both channels and frequencies are averaged, the shape of the resulting column is two-dimensional, where the first dimension is the number of rows and the second dimension is sample time.
If only channels are averaged, the shape of the resulting column is three-dimensional, where the first dimension is the number of rows, the second dimension is frequency, and the third dimension is sample time.
If only frequencies are averaged, the shape of the resulting column is three-dimensional, where the first dimension is the number of rows, the second dimension is channel (which can be referenced by name), and the third dimension is sample time.
If nothing is averaged, the shape of the resulting column is four-dimensional, where the first dimension is the number of rows, the second dimension is the channel (which can be referenced by name), the third dimension is frequency, and the fourth dimension is sample time.
Version note: New in 1.0.0
import numpy as np
import pickle
import mne
from mne.time_frequency import tfr_morlet
from matplotlib import pyplot as plt
from datamatrix import operations as ops, convert as cnv

# First read a simple dataset that contains data from three occipital EEG
# channels (O1, O2, Oz). `events` is an mne style array with event codes
# and timestamps. `dm` is a datamatrix with trial information.
with open('data/eeg-data.pkl', 'rb') as fd:
    raw, events, dm = pickle.loads(fd.read())
# Create an Epochs object. From there, create a TFR object. From there, create
# a multidimensional column.
epochs = mne.Epochs(raw, events, tmin=-.5, tmax=2, metadata=cnv.to_pandas(dm))
tfr = tfr_morlet(epochs, freqs=np.arange(4, 30, 1), n_cycles=2,
                 return_itc=False, average=False)
tfr.crop(0, 1.5)
dm.tfr = cnv.from_mne_tfr(tfr)
# Plot the
channels = dm.tfr.index_names[0]
plt.title(f'channels = {channels}')
# Average over trials and channels, but not frequency or time.
plt.imshow(dm.tfr[..., ...], aspect='auto')
plt.xticks(dm.tfr.index_values[2][::100], dm.tfr.index_names[2][::100])
plt.yticks(dm.tfr.index_values[1][::4], dm.tfr.index_names[1][::4])
plt.xlabel('Time (s)')
plt.ylabel('Frequency (Hz)')
plt.show()
Output:
Setting baseline interval to [-0.5, 0.0] s
Using data from preloaded Raw for 400 events and 626 original time points ...
50 bad epochs dropped
[Parallel(n_jobs=1)]: Done 3 out of 3 | elapsed: 0.8s finished
[32m⠸[0m Generating...
Arguments:
tfr-- No description- Type: mne.EpochsTFR
Keywords:
ch_avg-- Determines whether the data should be averaged across channels or not.- Type: bool
- Default: False
freq_avg-- Determines whether the data should be averaged across frequencies or not.- Type: bool
- Default: False
Returns:
No description
- Type: MultiDimensionalColumn
function from_pandas(df)
Converts a pandas DataFrame to a DataMatrix.
Example:
import pandas as pd
from datamatrix import convert

df = pd.DataFrame( {'col' : [1,2,3] } )
dm = convert.from_pandas(df)
print(dm)
Output:
+---+-----+
| # | col |
+---+-----+
| 0 |  1  |
| 1 |  2  |
| 2 |  3  |
+---+-----+
Arguments:
df-- No description- Type: DataFrame
Returns:
No description
- Type: DataMatrix
function to_json(dm)
Requires json_tricks
Creates (serializes) a json string from a DataMatrix.
Arguments:
dm-- A DataMatrix to serialize.- Type: DataMatrix
Returns:
A json string.
- Type: str
function to_pandas(obj)
Converts a DataMatrix to a pandas DataFrame, or a column to a Series.
Example:
from datamatrix import DataMatrix, convert

dm = DataMatrix(length=3)
dm.col = 1, 2, 3
df = convert.to_pandas(dm)
print(df)
Output:
   col
0    1
1    2
2    3
Arguments:
obj-- No description- Type: DataMatrix, BaseColumn
Returns:
No description
- Type: DataFrame, Series
function wrap_pandas(fnc)
A decorator for pandas functions. It converts a DataMatrix to a DataFrame, passes it to a function, and then converts the returned DataFrame back to a DataMatrix.
Example:
import pandas as pd
from datamatrix import convert as cnv

pivot_table = cnv.wrap_pandas(pd.pivot_table)
Arguments:
fnc-- A function that takes a DataFrame as first argument and returns a DataFrame as sole return argument.- Type: callable
Returns:
A function takes a DataMatrix as first argument and returns a DataMatrix as sole return argument.